A timeline of Covid-19 in Italy
This timeline of the evolution of the epidemic in Italy goes back to 24th February - the first day the Italian Civil Protection started sharing official data about the COVID-19 outbreak - and it is updated daily.
Each column represents an indicator. The bars represent the cumulative value by day (with the New Cases column showing daily value). The width of each bar shows the number of people affected. Hover on the bars to see the details for each day.
It all started on 31st January

On 31st January, the Italian media reported the first cases of Covid-19 in Italy: a Chinese couple from Wuhan who fell ill while in Rome.
They were quickly hospitalised and isolated, and the Italian health authorities started tracing their path back to understand who they had been in contact with. The result was appalling. During the previous week, the couple had visited some of Italy’s major tourist destinations: Milan, Verona, Parma, Florence, and of course Rome.
On the same day, Italy cancelled all direct flights to and from China and declared a state of emergency. From this day on, things started to accelerate dramatically.
On 21st February, an unassociated cluster of 16 cases was confirmed in Lombardy, in northern Italy.
On 22nd February, the Council of Ministers announced a new decree-law to contain the outbreak, including quarantining over 50,000 people from 11 different municipalities in northern Italy.
On 4th March, the Italian government closed all schools and universities nationwide as Italy reached 100 deaths and put all sport and public events on hold for at least one month.
On 11th March, Prime Minster Conte ordered the closure of most commercial activities except for those selling basic commodities such as pharmacies and supermarkets.
By 17th March, Italy had already become the second worst affected country by COVID-19, right after China.
Has Italy crossed the peak?
The following chart shows how the number of new cases is evolving over time in Italy and in every Italian region. Each point corresponds to the weekly moving average (i.e. the average value of the current day and the previous and following 3 days): this statistical calculation method, often used in technical analysis of financial data, helps smooth out short-term fluctuations and highlight longer-term trends.
In this chart, the figure for each day is calculated as the average number of new cases registered on that specific day and in the previous six days. We noticed a few patterns in the data: on Sundays and Mondays, for instance, the number of new cases is usually lower than in the other days of the week, and it tends to increase again on Tuesdays. By relying on the moving average calculation method, we managed to make these trends more visible.
Is a second wave coming?
During the month of August, the number of registered COVID-19 cases in Italy started to climb again. Occasionally, it reached levels that are very similar to the ones registered during last spring.
Are we headed towards the so-called ‘second wave’ or is the increase caused by some other factor?
Clearly, the situation is not as tragic as earlier this year: our hospitals are currently under no pressure and even the number of ICU patients and fatalities seem under control. So why are new cases increasing again?
Possibly, because the number of swab tests increased. Since newspapers report bare numbers, comparing the pre- during- and post-lockdown scenarios proves particularly hard. With this chart, we tried to show these data in a visual way.
The chart uses two different scales on the y-axis. Each bar, plotted on linear numeric scale, represents one day, its height showing the number of swab tests performed (in green) and the number of new cases (in white).
Overlapping the bars are a magenta linear scale representing the percentage of new cases out of the total number of swab tests performed, and a white dashed line representing the average percentage over the entire period.
Apparently, the number of tests has a direct impact on the number of new cases: after the first period, when swab test supplies were very low and only patients with severe symptoms were tested (so much so that the ratio once skyrocketed to over 46%), the percentage line went down and has been almost flat (between 1 and 3%) during the summer, to start increase again in October.
On a side note, considering that swab tests are currently tracking a huge number of asymptomatic cases - clearly, most of these these patients would not have had access to the test last February or March - the chart might also help explain why, despite still spreading, the virus is having a lower impact on our society compared to five months ago.
The chart shows a bar for each day. The height of the bars represents the total number of tests for that day (green bar) and the number of tests that returned a positive result (i.e. new cases, white). The lines use a different scale on the y-axis, they show the daily percentage of new cases vs total tests (magenta line) and the average percentage of the whole period. As long as the magenta line stays flat, the situation should be under control.
How is today's situation compared with the first wave?
Figures are increasing again, and the number of new cases skyrocketed over the last few weeks reaching levels even higher than the ones registered during the peak. But how are all the other indicators? Are we about to be dragged into despair once again? In this chart, we compare today’s four key indicators (new cases, fatalities, people in hospital, and people in ICU) with the same indicators from the most ‘similar’ days in the past in terms of new cases.
To create this chart, we split the COVID-era into two: the first period starts with the beginning of the lockdown (11th March) and ends on the day of the first peak (21st March). The second one starts with the peak and ends with the end of the lockdown (4th May). For each period, we picked the most ‘similar’ day to each new day presented in the chart in terms of new cases (i.e. the one where the delta from today’s number is lower). We also added the peak day itself, and the day with the lowest number of new cases, just to give a more comprehensive picture of the situation. The line on the chart represents the “warning level” weighted on the number of ICU admissions, which might indicate a serious problem for the national healthcare system.
Progress of the epidemic in each Italian region
Italy’s national health service (Servizio Sanitario Nazionale) is organised under the Ministry of Health and administered on a regional basis: each one of the nineteen regions (and the two autonomous provinces of Trento and South-Tirol that form the “Trentino Alto-Adige/Südtirol” region) has its own organisation and rules. Epidemic control is coordinated by the government through the Ministry of Health, the ISS (Istituto Superiore di Sanità), and the Civil Protection, yet that does not prevent regions from setting local rules in order to improve the effectiveness of the efforts. For instance, Lombardy is now funding and building a new COVID-19 hospital with a capability of over 400 beds, more than half of them in ICU, on the premises the old Milan Fairground.
These charts show the evolution of daily numbers in all the Italian regions. Each bar represents the confirmed amount of Cases, Fatalities and Recoveries - depending on the option selected. The pink line shows the 7 days moving average of the same indicator. Some of the daily data show anomalies (or possible adjustment with not-recorded data from previous days), the moving average helps to decrease the effect of these odd numbers in the overall view.
Things seemed under control, until they were not
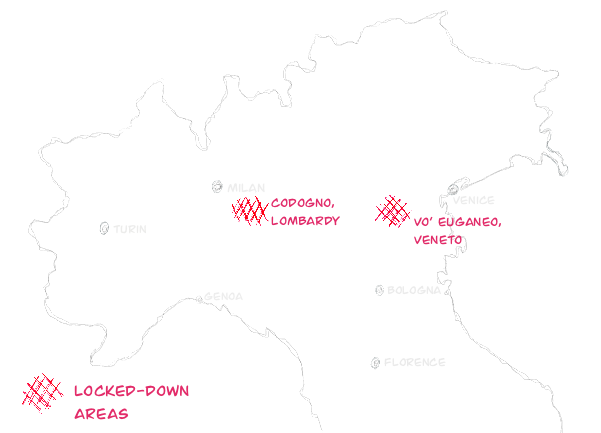
After going silent for one month, the virus had such a devastating outbreak that the Italian government quarantined two huge areas in Lombardy. The so-called Red Zones have been locked out from the rest of the country so that nobody could enter or leave them. Barely two weeks after the outbreak, the Italian government realised that its efforts had not worked as expected and had to be strengthened.
Daily recoveries and new cases
The comparison between the amount of daily new confirmed cases and the recoveries shows the strain on the National Healthcare System. A balanced proportion between recoveries and new cases represents a scenario in which the system is coping sufficiently with the Covid-19 crisis. The following chart shows how after the peak of daily new cases around the end of March, the two indicators are converging towards each other. The hope is to see the number of recoveries to cross the daily cases followed by a trend towards zero of both the lines.
The chart shows the weekly moving average of new daily cases and daily recoveries. This statistical calculation method, often used in technical analysis of financial data, helps smooth out short-term fluctuations and highlight longer-term trends.
And then everything fell apart
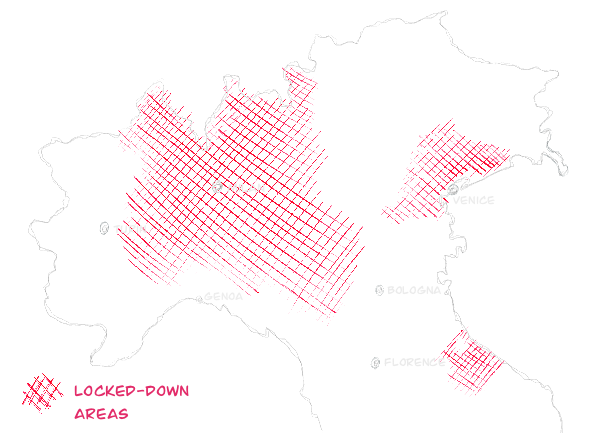
On Saturday, 7th March, the whole region of Lombardy and fourteen more provinces were locked down. Because Lombardy alone contributes to more than 22% of the Italian GDP, this measure also basically meant locking down the world’s 8th biggest economy.
On 9th March, the Italian government decided to lock down the entire nation in a desperate attempt to slow down the spreading of the disease.
A comparison matrix
This matrix shows how the different Italian regions reached a specific set of milestones during the course od the epidemic. By selecting one of the indicators, you will be able to see how the pandemic spread at different speeds in different areas of the country. The marker indicates the first day on which the event has occurred in each region.
For mobile users, the regions are shown as aggregated into macro-regions: “Northern Italy” includes Aosta Valley, Piedmont, Lombardy, Liguria, the Autonomous Provinces of Bolzano and Trento, Veneto, Friuli Venezia Giulia, and Emilia Romagna. “Central Italy” includes Tuscany, Lazio, Umbria, and Marche. “Southern Italy” includes Campania, Calabria, Puglia, Molise, Abruzzo, Basilicata, Sicily, and Sardinia. In this case, the marker indicates the day on which the event has occurred for the very first time within the macro-region.
We grouped the milestones in six different clusters: total cases, new cases, active cases, fatalities, hospitalised, and admitted in ICU. Each one of them has a unique corresponding symbol. The color of the symbol represents the the number of people affected, with a progression that starts from 100 to go to 100,000.